Archive
MDX #43–Find a MDX Calculation Script
Finding out MDX calculation scripts is a common task
A co-worker recently asked me what the calculation for a calculated measure is in our reporting cube.
If you have the Analysis Services project in Visual Studio locally, it is easy to find what the calculation script is from the Calculations tab in the cube designer.
But what if you don’t have the VS project handy, and you have access to the cube from SQL Server Management Studio?
EXPRESSION field in $SYSTEM.MDSCHEMA_MEASURES
Here is a simple script you can run to quickly get the calculation script.
This script queries the SSAS Dynamic Management View $SYSTEM.MDSCHEMA_MEASURES. The EXPRESSION field will return the actual calculation script. You will need to run the DMV queries in the MDX query editor, not the SQL query editor.
Here is the result.
Here is the query in text.
SELECT CUBE_NAME
, MEASURE_UNIQUE_NAME
, EXPRESSION
, MEASUREGROUP_NAME
from $SYSTEM.MDSCHEMA_MEASURES
where MEASURE_UNIQUE_NAME = ‘[Measures].[Ratio to Parent Product]’
Use $SYSTEM.DBSCHEMA_COLUMNS to find all the columns in a DMV
You might ask how do I know what are all the columns in this view. Here is a DMV view, $SYSTEM.DBSCHEMA_COLUMNS, you can query to find out all the columns in a DMV view.
Here is the result.
Here is the query in text.
SELECT *
FROM $SYSTEM.DBSCHEMA_COLUMNS
WHERE TABLE_SCHEMA = ‘$SYSTEM’
AND TABLE_NAME = ‘MDSCHEMA_MEASURES’
$SYSTEM.DISCOVER_SCHEMA_ROWSETS is the only DMV name you need to remember
You might also ask how would I know to use the view $SYSTEM.MDSCHEMA_MEASURES to find out the calculation script.
The answer is to just remember one view, $SYSTEM.DISCOVER_SCHEMA_ROWSETS.
SELECT * FROM $SYSTEM.DISCOVER_SCHEMA_ROWSETS
The $SYSTEM.DISCOVER_SCHEMA_ROWSETS view will show you all the DMV views that you can use to get the metadata about your dimensions and cubes.
DMVs can be very useful for documenting SSAS databases, monitoring usage and activity. To know more about how to use these DMVs check out our book “MDX with SSAS 2012 Cookbook”.
Book Review: Why You Should Read Expert Cube Development With SSAS 2012 Cover to Cover
Expert Cube Development with SSAS 2012 Multidimensional Models was published earlier this year by Packt Publishing. It’s the second edition of the very successful book on SSAS cube development by three well-known industry leaders, Chris Webb, Alberto Ferrari and Marco Russo.
This book is not a tutorial book on using SSAS as a tool. It is more of a guided tour through the lifecycle of building an Analysis Services solution with an informed commentary telling you what to do, what not to do, and what to watch out for.
Reading this book cover to cover
If you are a SSAS cube developer, you would want to read this book cover to cover, no matter what level you are, with the exception of absolute beginners who do not understand basic Analysis Services concepts yet, such as what a cube and a dimension is.
I bought the first edition a few years ago, but didn’t read it cover to cover because at the time I didn’t find some of the topics relevant to my work. Earlier this year I bought the second edition and I found myself unable to put the book down. By the time I knew it, I had already read it cover to cover once, with pages of notes in Microsoft OneNote. Knowing that my cube development skills could have progressed much faster, I wish I had read the book a few years ago cover to cover.
So don’t repeat the same mistake I made. Whether you already have the first edition or just bought the new 2012 edition, go ahead and start reading it now.
What I enjoyed about the book
I don’t wish to spoil your fun with the book, so I’ll just gloss over a few key points about the book.
- Beginner developers might think that cube development is all about how to use SSAS as yet another tool. This book will change your mind. The big chunk of Chapter 1 focused on the data modeling for Analysis Services. Then the book moved on to Chapter 2 to show you how to build basic dimensions and cubes. More complex dimension modeling is covered in Chapter 3. Data modeling for measures and measure groups is covered in Chapter 4. What I enjoyed the most is how the book presented the challenges we all encountered in our day-to-day work and provided the best practices in terms of data modeling in Analysis Services multidimensional model.
- Microsoft Analysis Services is not a standalone technology, it’s part of a family of technologies and disciplines that all work together to make it possible for end-users to do interactive data analysis, reporting, and visualization. From a developer’s point of view, these technologies include the SQL Server engine, the Reporting Services, the Analysis Services, with the Integration Services in the middle as the glue. The disciplines include, but are not limited to, data warehouse data modeling, multidimensional modeling, and designing and implementation for performance and good user experience. I personally find that being able to fit all these techniques and disciplines together in the lifecycle of building an Analysis Services solution is not an easy task. Throughout the book the authors did a fantastic job of showing how each technique and discipline can fit seamlessly to build high performance cubes.
- As a tool, Analysis Services is very easy to use; some might say too easy. Dimensions and cubes are built with various wizards with properties already being filled with default values. You can have a cube up and running in a matter of minutes. Some properties are for cube’s client tools to consume, but many of the properties are cube’s metadata and will end up having some impact on the cube processing performance, query performance, and/or storage engine performance. Assuming that your cube has started its life with a good design, then a good portion of a cube developer’s job is to understand what those impacts are and to make informed trade-off decisions. This book is a life-saving book that tells you what those properties mean, what to do with them, what not to do, and what to watch out for.
- Bad cube query performance can be detrimental for your Analysis Services projects. The book has devoted an entire Chapter 8 to query performance tuning. The concept of query performance tuning is very familiar to SQL Server developers, but cube query performance tuning methodology has its own twist and turns, such as the Formula Engine vs. the Storage Engine, the partitions and aggregations, and tuning an algorithm in MDX. The book explains in detail what to do with each methodology and even the right tools and scripts to use to get the job done correctly.
- I also like the many links in the book to other very detailed white papers, such as “The Analysis Services 2008 R2 Performance Guide”, and “The Many-to-Many Revolution”. Many blog posts are also included in the book, such as the blog posts from Mosha Pasumansky who was considered the most influential person in MDX.
No covering of SSAS Tabular models
As you may know, as of SQL Server 2012, there are two versions of Analysis Services: Multidimensional and Tabular. Although both of them are called Analysis Services and can be used for much the same purposes, the development experience for the two is completely different.
I have bought the first edition a few years ago. Although this is basically the same book as the first edition, I still went ahead and bought it because the 2012 edition has a new section that talks about the DAX query support in SSAS 2012 multidimensional model. Don’t get me wrong, this book only covers SSAS Multidimensional models. But it’s nice to have a new section on how SSAS 2012 multidimensional model supports not only MDX queries, but also DAX queries.
No substantial changes in this second edition
Since there are no substantial changes in this second edition, it’s probably not worth buying a copy of the second edition if you already have a copy of the first edition. What is covered in the first edition should work perfectly fine in SSAS 2008 and 2012, and even in 2014. This is because Microsoft has not added anything that is substantially new to SSAS Multidimensional models since the 2008 version. But if you don’t have the 2008 edition, I’d recommend you to buy this new 2012 edition, even if you are still working on cubes in SSAS 2008.
Not a book for absolute beginners
If you still need to understand basic Analysis Services concepts, such as what a cube and a dimension is, then this book is not book for you. This book does not take the form of a basic tutorial either.
Authors’ personal experience and thoughts are invaluable
Chris Webb, Alberto Ferrari, and Marco Russo are well-known in the SSAS and MDX community. This is an invaluable book because it contains their personal experience and thoughts. I myself visit Microsoft books online (BOL) very often. But if a book is solely derived from BOL then it is not too useful for me, as I can read it in the BOL myself. I am putting this review on my blog, and also planning to put it out on Amazon and Barnes and Nobel, hoping that all cube developers will read the book cove to cover.
Packt Publishing
Packt Publishing is one of my favorite tech book publishers. Their books focus on practicality, recognizing that readers are ultimately concerned with getting the job done. They also offer a subscription service, which I personally also use. Good job for putting out “Expert Cube Development with SSAS 2012”!
SSAS #28 – Setup to Learn SSAS Stored Procedures
Having worked with SSAS for a while and done some reporting with MDX queries, I started to explore opportunities to write SSAS “stored procedures”. I stumbled on a few blocks along the way to even set up the development environment properly before I got chance to identify scenarios to justify the effort.
Learn from Expert – Analysis Services Stored Procedure Project on CodePlex
I find that the best place to start is to learn from expert. The above project has been around for quite a while, and is a wonderful place to start. But gluing all the pieces together is still tough.
Here are the notes from my exploration.
What are Assemblies on Analysis Services?
Analysis Services stored procedures are not written in MDX (as TSQL stored procedures written in TSQL). They are really “functions” that are associated with a common language runtime (CLR) or Component Object Model (COM) class. The class is in the form of a dynamic link library (DLL) , and needs to be registered as an assembly on the Analysis Services server or in an Analysis Services database.
Register the DLL file on the AS Server
Once I have the DLL file, I can go to the the AS Server, and register it as a server assembly.
A few things about the registration.
- As for the Type of assembly, we have choice of either.NET Assembly or COM DLL. Since the ASSP project used C#, choose .NET Assembly. Although Analysis Services supports both COM and CLR assemblies, CLR assemblies are recommended because of the enhanced security available to CLR assemblies. See Using Stored Procedures (MDX).
- Assembly Name: ASSP is the namespace of the ASSP project, and all the functions will need to be prefixed with ASSP for execution.
- Permissions: I am not exactly certain what each level of permissions entail, but certain functions in the ASSP project need “Unrestricted” permission.
- Impersonation should be left as Default.
Referencing ADOMD.NET in a C# Class Library Project
Creating a Class Library project in C# is straightforward, except the References setting.
- ADOMD.NET has exposed both the Analysis Services server and client components through ADOMD.NET.
- Microsoft.AnalysisServices.AdomdClient: this is the namespace in ADOMD.NET that allows all client side programming against the AS. The file Microsoft.AnalysisServices.AdomdClient.dll was found under C:\Program Files\Microsoft.NET\ADOMD.NET\90.
- Microsoft.AnalysisServices.AdomdServer: this is the namespace in ADOMD.NET that allows all server side programming against the AS. The DLL file name msmgdsrv.dll is found on my PC under C:\Program Files\Microsoft Analysis Services\AS OLEDB\10\.
Versions of Target .NET Framework
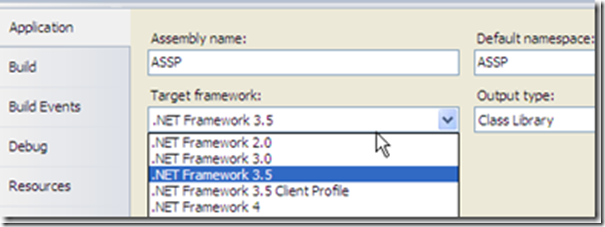
Both the client and server references of ADOMD.NET on my PC are version 9. After a few trial and error, I found that I can set the Target .NET Framework to 2.0, 3.0 or 3.5 (except 4.0), and the DLL worked for the AS 2008 R2.
Run the first ASSP Like()
The Like() stored procedure is simple enough.
So much work….
but I still haven’t found a scenario where using an Analysis Services stored procedure is justified….but I am pretty sure it’s worth the effort to set up a development environment, just in case….
SSIS #113 – Querying SSAS Cube with MDX from SSIS
I worked on a SSIS package a few months back to retrieve data from a SSAS cube with MDX queries. A co-worker recently is developing a SSIS package to perform a similar task, but couldn’t get the SSIS package to work. The data flow was lost somewhere and the package could never finish the data loading.
This is what it will look like in the Data Flow task. The OLE DB Source will stay yellow forever.
I couldn’t remember right away how my SSIS package was configured to make the data flow work. I had to find my old SSIS package and open it to refresh my memory.
Need to set Format=Tabular in the Data Link Extended Properties
After choosing the OLE DB Provider for Analysis Services 10.0 as the provider for the connection manager, we need to go to the All tab to set Format=Tabular in the Data Link Extended Properties.
There are many blogs on this little “secret” developers discovered. Some claimed that this is a fix for a bug in SSIS 2005 SP1. I had to do this in both SSIS 2005 and 2008 to make it work. So I am not sure if it is caused by a bug or a designed “feature” in SSIS.
Neither can I find more information about what this property value means. You are welcome to share if you have more insight on this.
The happy green color is what you will see once you set Format=Tabular in the Data Link Extended Properties.
A couple of notes:
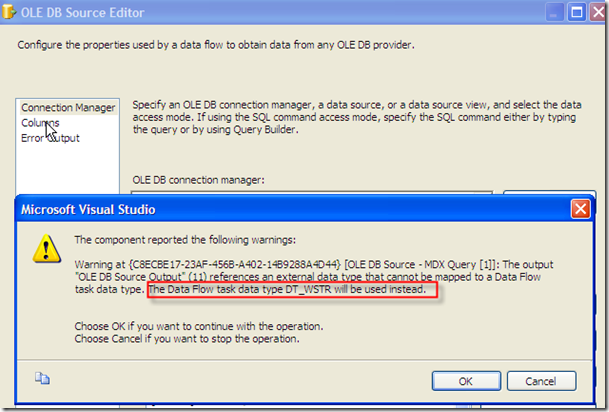
1. About the data type. Whenever you try to access the column information, you will get a “nice” warning from SSIS that data type DT_WSTR (nvarchar) will be used instead. Again if you have more insight on this, you are welcome to share.
2. I used a Data Conversion transformation to convert the DT_WSTR to DT_STR or DT_NUMERIC accordingly.
SSAS #25 – A MDX question from a reader
Hi,
This is what I gathered from your question.
Need a MDX query get the data in required format.
ON COLUMNS:
DimValidScenario (Hierarchy Level: Scenario) (Members: Base, Flatterner, Value and so on)
ON ROWS:
DimAccount (Hierarchy Level From Level 02 to Level 05 Data)
DimPlan Name( Hierarchy Level 03 Data)
DimStatus( Hierarchy Level 03 Data)
I am making assumption that by “required format” you mean that certain dimensions need to be on columns, and other dimensions need to be on rows, and you do not need all the levels in the hierarchies, and you only need certain levels in certain dimensions.
The following is only a pseudo code to demonstrate what you can do.
- CROSSJOIN and *: they are basically the same, and similar to CROSS JOIN in SQL
- You nee to use level 02 to level 05 in a hierarchy in DimAccount. Since we can not use the same hierarchy more than twice in a CROSSJOIN function, you would need to use the attribute instead. I am assuming that you have already created the attribute relationships.
- Using the WHERE clause to limit your return dataset for testing purpose.
Thanks for your question.
Sherry
SSAS #24 – Implement Attribute Relationship in SSAS 2008
Do you still remember the blue squiggly from my previous blog post, SSAS #23 – Implement dimensional hierarchy in SSAS 2008?
On the Hierarchies tab in the Dimension Designer, the blue squiggly says:
“Attribute relationships do not exist between one or more levels in this hierarchy. This may result in decreased query performance.”
You’ve already know that this is a Best Practice Warning and it is telling us to create attribute relationships.
Fortunately, in SSAS 2008, attribute relationships are no longer a “hidden” feature, as in SSAS 2005 where there is no graphic to show the relationships. Now we have a dedicated tab with graphics. How cool can it get?
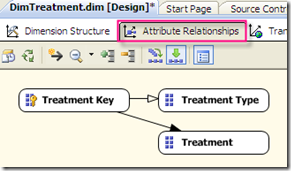
After the drag-and-drop of the two attributes, TreatmentType and Treatment, to the Hierarchies tab, the initial graphics on the Attribute relationships shows:
This is not exactly correct.
The correct graphics should be:
The trick here is to create the attribute relationships in reverse, that is, lower-order objects (many) then higher-order objects (one), instead of in the order of one-to-many.
There are two ways to get the relationships into the correct order.
One way –drag the lower-order object and drop in onto the higher-order object
Give it a try. Drag Treatment and drop it onto TreatmentType.
Another way – use the Attribute Relationships pane at the lower right corner.
Right click on the relationship. Select Edit Attribute Relationship…
Make sure these:
- The One side of the relationship = Source Attribute
- The Many side of the relationship = Related Attribute
- Relationship type = Rigid (in my example, the relationship will not change over time)
The blue squiggly on the Hierarchies tab disappeared
Here is the proof.
Closing Remark
In SSAS #22, 23 and 24 posts, I made the following assumptions:
- you will use the star schema in your data mart design, and
- there are natural one-to-many relationships among dimensional attributes, therefore,
- the dimensional hierarchical structures are stored in one single dimensional table, and
- the dimensional table is a non-parent-child table
- There are many discussions about Snowflake schema verses Star schema. If you use a Star schema, the Dimension Wizard will not be able to detect the natural hierarchies that exist.
SSAS #23 – Implement dimensional hierarchy in SSAS 2008
Let’s continue from my previous post, SSAS #22 – Dimensional Hierarchy Contained in a Single Dimensional Table (Star Schema).
I need to assume that you have done all the following so far:
- Created an Analysis Services Project in BIDS
- Created a Data Source to point to your star schema relational database (with proper connection string and impersonation information)
- Created a Data Source View with the fact table(s) and dimension table(s) you need for your project.
Step 1 – Create a dimension in Dimension Wizard
In my example, I need to create a dimension DimTreatment, with one key and 2 attributes.
Right click on Dimensions folder, and select New Dimension…
Dimension Wizard will pop up. Select Use an existing table to create the dimension.
Step 2 – Select a Key column and a Name Column
In the next Specify Source Information window, select your dimension table. The key column is automatically picked up by the wizard because the key column is defined in the DSV. The key column is also the default for the Name column. Because I do not have a description column for the key column, so leave the key column as the default for the name column.
Step 3 – Select dimension attributes
In the Select Dimension Attributes window, make sure you select all the attributes you need from your dimension table.
Step 4 – Dimension Structure Tab – Showing Attributes without Hierarchies
This is the final result from the Dimension Wizard. It shows all the dimensional attributes you have selected. No hierarchical structures yet.
If you are a very observant person, you will see a blue squiggly under the name of the dimension. Pointing the cursor to it.
"Create hierarchies in non-parent child dimensions."
This is one of the many Best Practice Warnings in SSAS 2008. The warning is saying that you need to create some sort of hierarchies in your dimension table. As a best practice, that is.
Step 5 – Create a hierarchy
We are happy to oblige in the case. We do need a hierarchy between attributes, Treatment and TreatmentType. We also hope that the blue squiggly will go away,
Simply drag attribute TreatmentType to the Hierarchies tab, and Treatment as well. Also rename the hierarchy name to something meaningful rather than the default Hierarchy.
You will probably get annoyed now, because we are getting more blue squiggly now. This one is under the name of the hierarchy.
“Attribute relationships do not exist between one or more levels in this hierarchy. This may result in decreased query performance.”
This Best Practice Warning is telling us to create attribute relationships.
Before I take a break, I just want to show you a snapshot of the new visual Attribute Relationships tab in the Dimension Designer in SSAS 2008.
I’ll continue in the next blog post to discuss why we need to create attribute relationships and how to do it in SSA 2008.
SSAS #22 – Dimensional Hierarchy Contained in a Single Dimensional Table (Star Schema)
We have been building hierarchical structures in transactional/operational systems for years with technique such as normalization. What about hierarchical structures in an OLAP system? Experienced data mart/warehouse designers will tell you that they are different because the hierarchy for the dimension is actually stored in a single dimension table.
In a start schema, that is.
Yes, it is true. In a star schema, we do not need to break hierarchies into separate tables. One single dimension table can contain natural hierarchical structures among the dimension attributes.
Sometimes, we use a more normalized structure, and break the hierarchies into separate tables. The result is a snowflake schema.
This blog post is not about star schema verses snowflake schema. It’s about implementing a natural hierarchy that is contained in a single dimensional table in Analysis Services.
In this first blog I’ll show you one simple dimension table that contains such natural hierarchy. Implementing this kind of dimensional hierarchies in SSAS 2008 is simple enough, with a few tricks. I’ll show you how to do that in the next blog post.
Data Source View – Fact & Dimension Table
This is a screen shot of my simple fact table and the simple dimension table.
Besides the key column on the dimension table DimTreatment, there are two attributes, TreatmentType and Treatment.
Store one-to-many relationship in a single dimension table
These two attributes contain a natural one-to-many relationship, that is, several treatments can be grouped into one treatment type.
Storing this one-to-many relationship (hierarchy) in a single dimension table allows for the easiest browsing of the dimensional data. In this simple example, users could easily choose a treatment type and then see the list of all the treatments within the treatment type.
In the next post, I’ll show you how to implement the above one-to-many relationship/hierarchy in SSAS 2008.
SSAS #21 – Steps to create a SSRS report with MDX accessing a Cube
I wasn’t sure if I should put this blog under SSRS or SSAS category. SSAS category won by default because I do not have many SSAS posts.
In my last SSAS #20 post, I blogged about how to use the out-of-box Analysis Services processing tasks in SSIS to process dimensions, partitions, and measure groups.
In this blog post, I’ll show you the out-of-box features in SSRS you can use to create a report that accesses your cube.
I know I am skipping a lot of steps, such as how I designed the star schema for my data mart, how I designed my SSIS package to load data into the data mart, and how I created and deployed my Analysis Services database.
Analysis Services database – asLMRUWDashboard
For the purpose of this blog post, I’ll just show you my final product, asLMRUWDashboard, an Analysis Services database. I have 5 dimensions, and two of them have user defined hierarchies. It’s a very simple and small database. Even with 5 dimensions, the size of the AS database is less than 1 MB.
5 Parameters in the final SSRS report
My final SSRS report will have 5 parameters. The first 2 will be from my Data dimension, and other 3 are from the Site dimension, the Treatment dimension, and the Review Type dimension. I am ignoring the Lien dimension. I am also ignoring the attribute hierarchies for now.
Data in a Matrix
I need my data to display the date dimension horizontally, and other dimensions vertically. I will need a matrix to do this.
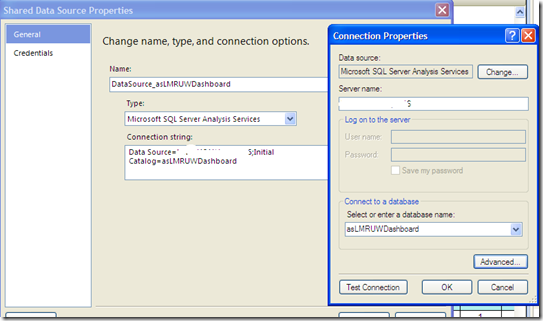
Step 1 – Create a shared data source for Analysis Services database asLMRUWDashboard
I am using BIDS 2008. The steps should be the same or similar in BIDS 2005. (I am down playing the difference between BIDS 2005 and 2008. But the truth is you will never want to use BIDS 2005 again if you have ever put your hands on BIDS 2008, especially when it comes to using Matrix.)
This is a straightforward step. Make sure you choose Analysis Services as the Type of the source.
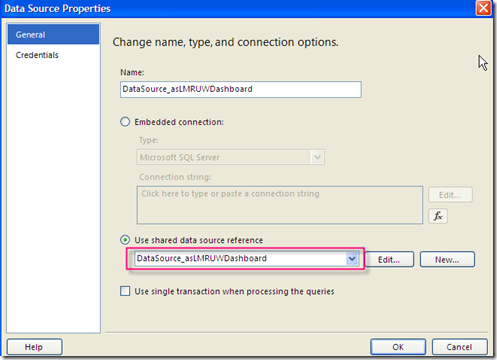
Step 2 – Create a Data Source to use the above shared data source
In the Report Data tab, click New and select Data Source…
Make sure you select the data source you just created.
Now you should have a data source created that points to the AS.
Step 3– Create a Dataset to use the above shared data source
Right click the data source and select Add Dataset…
In the Dataset Properties window, ignore the query for now. It’s my final MDX query. I didn’t hand write it. Instead, click the Query Designer button.
What shows up is actually the cube browser, which is the same cube browser you have seen in SQL Server Management Studio and in Analysis Services project in BIDS.
To create parameters for your report, just simply drag and drop dimensions/attributes onto the top portion of the Query designer, and make sure you check Parameter. The Query Designer will automatically create parameters and default datasets for each check mark.
Then start to drag and drop the measure(s), and dimensions into the bottom portion. The bottom portion is only showing data in a tabular format. do not worry about this yet. You will have opportunity to put your data in a matrix later.
Step 4 – Examine the Parameters that have been created.
Parameters and parameter values are automatically created.
Step 5: Create a matrix with three row groups, and one column group.
The three Row Groups have parent/child relationships. The Column group will be from the Date.
Preview your report. You will see the report parameters. Start to create and format the sub totals in the matrix. You will have a very impressive report.
Hope this blog post will motivate you to create your first cube and first SSRS report to access a cube.


